

Every screen on this boat is a web page we built ourselves, drawn the way our boat is wired and read from across the cabin. No chartplotter maker made them, and nobody can switch them off with a software update.
Plain web pages, running on a small computer that sips power
Everything on the boat that measures something ends up in one place: a Raspberry Pi running OpenPlotter and Signal K.
Signal K is the part that collects it all — the GPS, the wind instrument, the depth sounder, the battery management systems, the solar controllers, the weather station — and hands it out to anything that asks, live. Our screens are ordinary web pages (HTML, a little styling, a little JavaScript) that ask for the numbers they care about and draw them as tiles, gauges and diagrams.
That's the whole trick, and it's why they're so easy to change. A screen is a file. If we want the battery percentage bigger, a new tile, a different colour for amps, or a number in Fahrenheit instead of Kelvin, we edit a file and press refresh. The text is deliberately huge — these are read from across a cabin, in bright light, at three in the morning — and every one of them keeps working with the internet completely down, because everything they need is already aboard.
The same pages open on the boat's own screen, on a phone, or on a laptop, over the boat's network. Nothing to install.
The one that's up all day
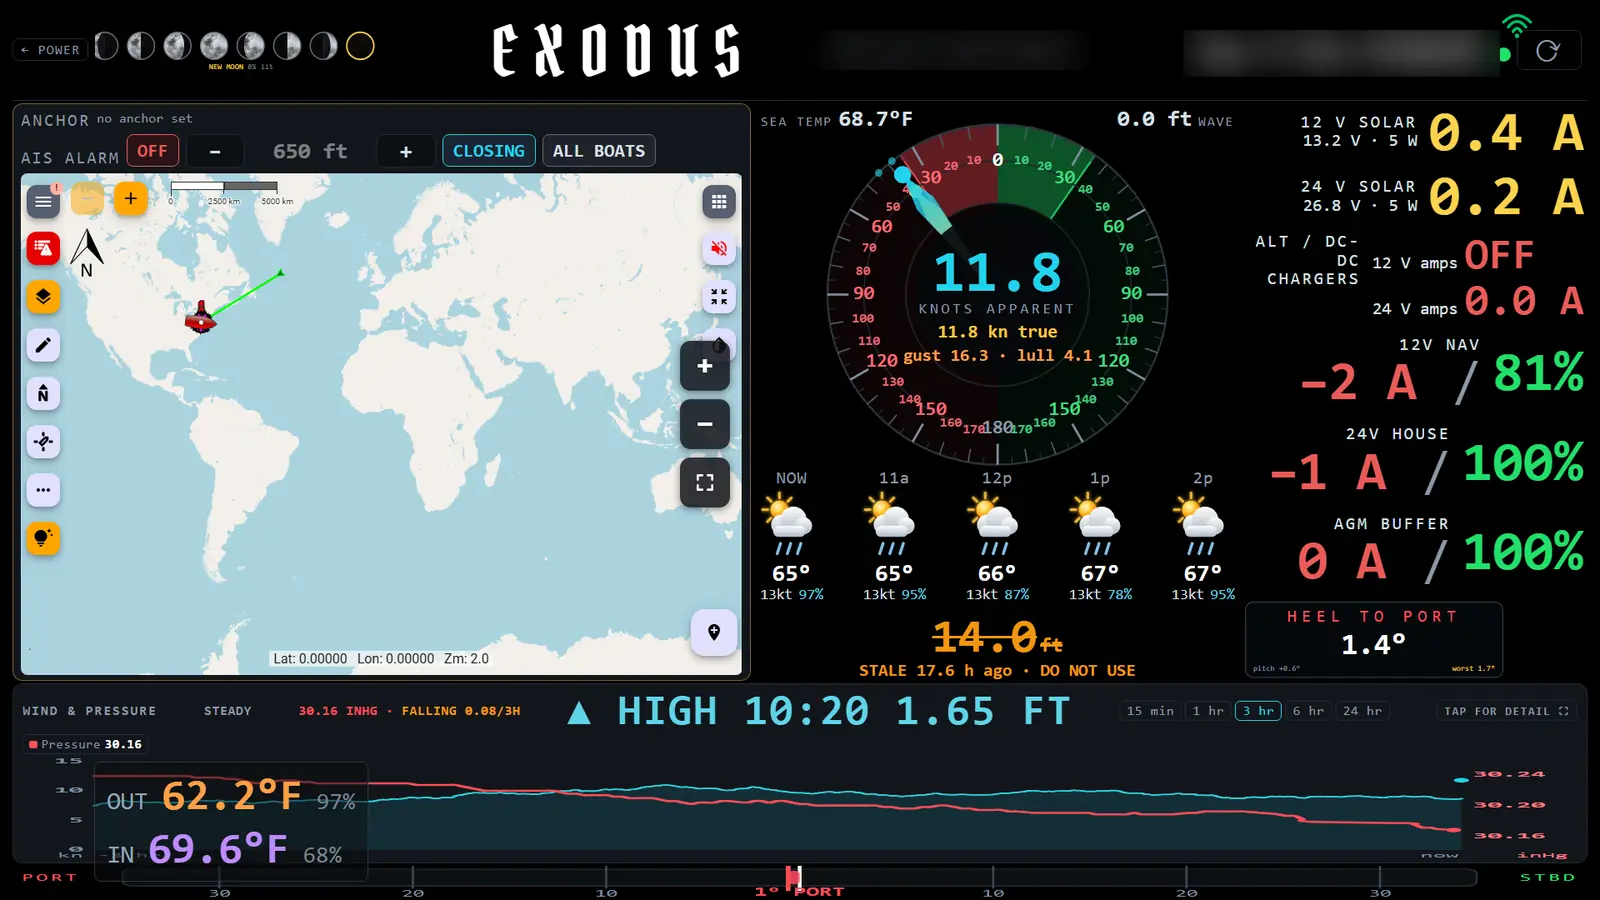
The home screen. Wind and weather in the middle, charging and the three battery banks on the right, wind and pressure history along the bottom. (Position and clock are blurred for this page.)
Everything you'd glance at while making coffee, in one view. The wind gauge shows apparent and true wind with gusts and lulls, there's a weather strip for the next few hours, the tide and sea state sit underneath, and the right side is the battery bank state of charge, solar amps and the DC-DC chargers.
The box on the left is a web page inside the page, so we can put whatever we like in it: Freeboard-SK, OpenCPN, qtVlm, Windy, or any web page at all. We haven't settled on a favourite, so it changes.
Its real job is the anchor alarm. When you're sitting at anchor for days, you don't want a power-hungry computer or a big screen running just to watch a circle on a chart. The Pi sips power and runs a tiny anchor alarm, and this tile is its window. That's the reason it exists.
Almost everything on the home screen opens something bigger
The home screen is the summary. Touch any part of it and a bigger view slides over the top. Close it (the close button, the dark area around it, or the Escape key) and you're back where you were, ready to open the next one.
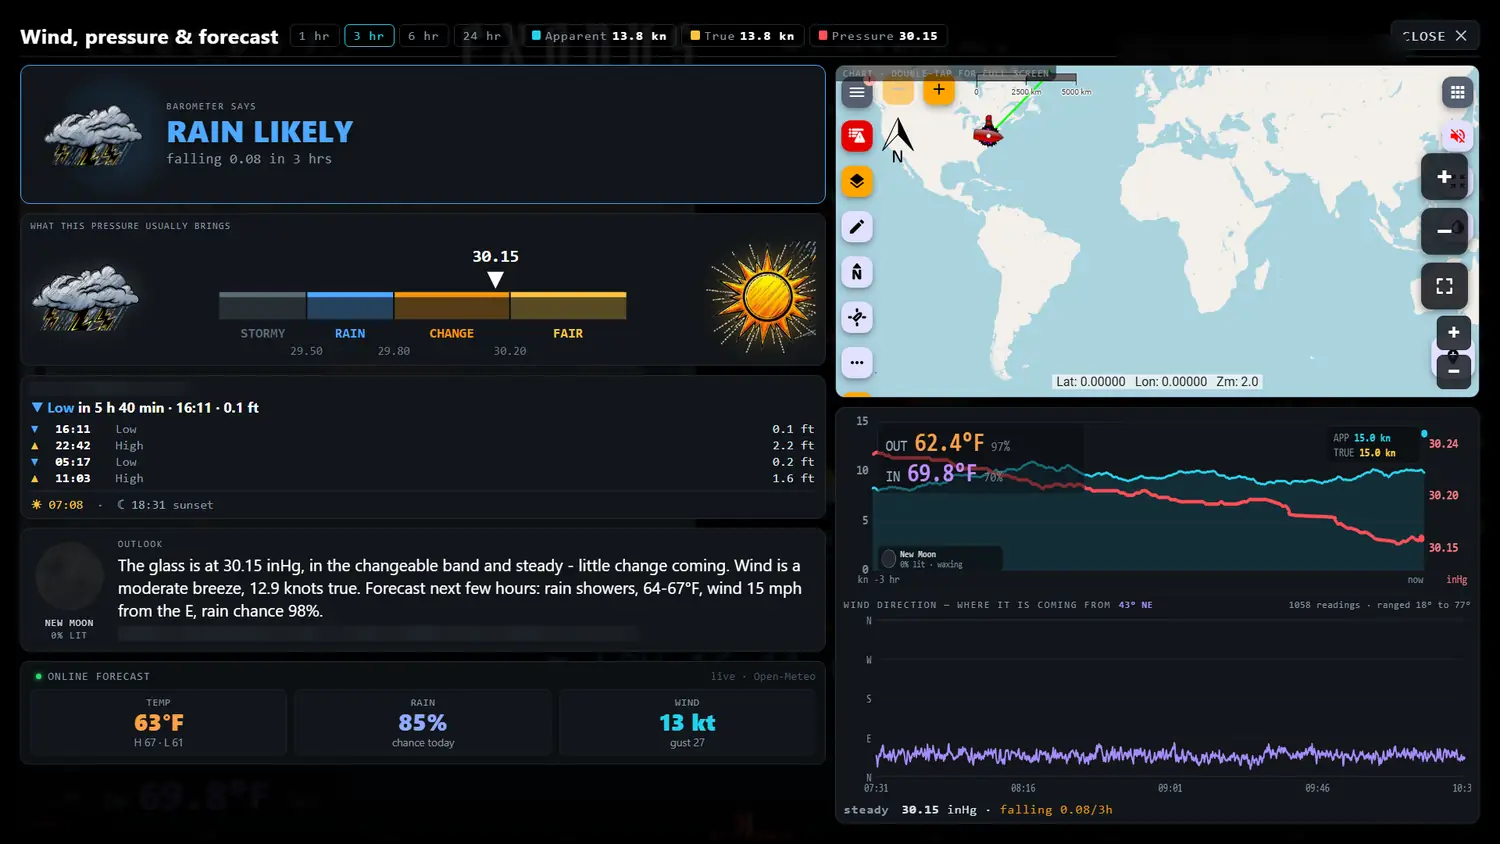
Tap the wind gauge or the strip along the bottom. (The station and town names are blurred for this page.)
This is the full weather picture on one screen. Top left, the barometer gives its call in a few words. Under it is a scale of what the current pressure usually brings, then the next few tides and sunrise and sunset, and then a plain-English outlook that puts the barometer, the wind and the official forecast into one paragraph. If the boat has internet there's also a live temperature, rain-chance and wind forecast; with no internet that box simply isn't there. On the right is a chart, and under it the wind and pressure traces and a graph of which way the wind has been coming from.
The buttons across the top choose how much history to draw, from one hour to a day, and the three coloured chips (apparent wind, true wind, pressure) switch each line on and off.
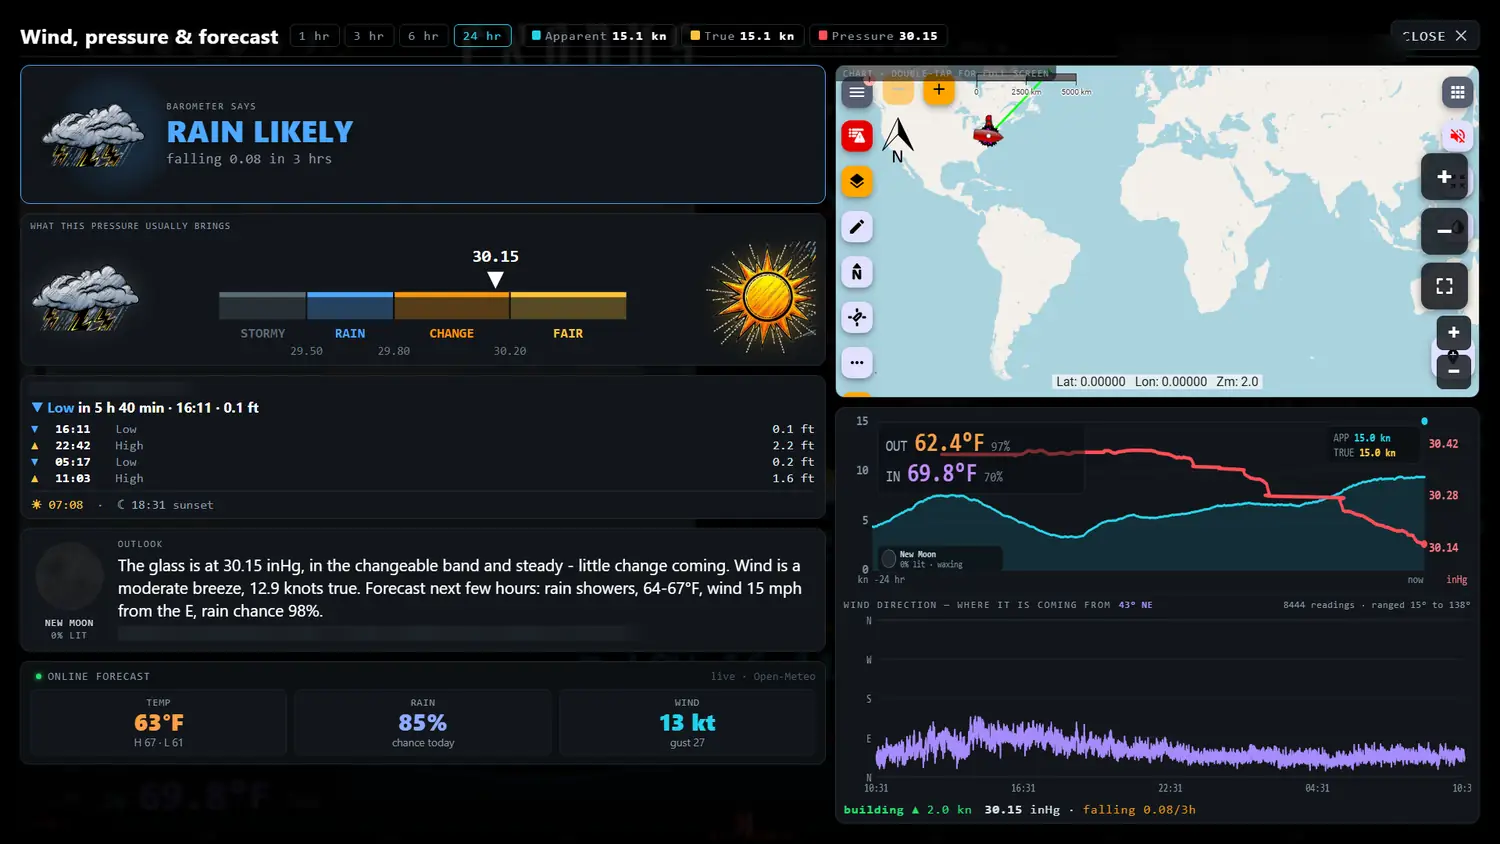
The same screen on the 24 hour button: a whole day of wind and pressure, and a pressure line that shows the front coming through.
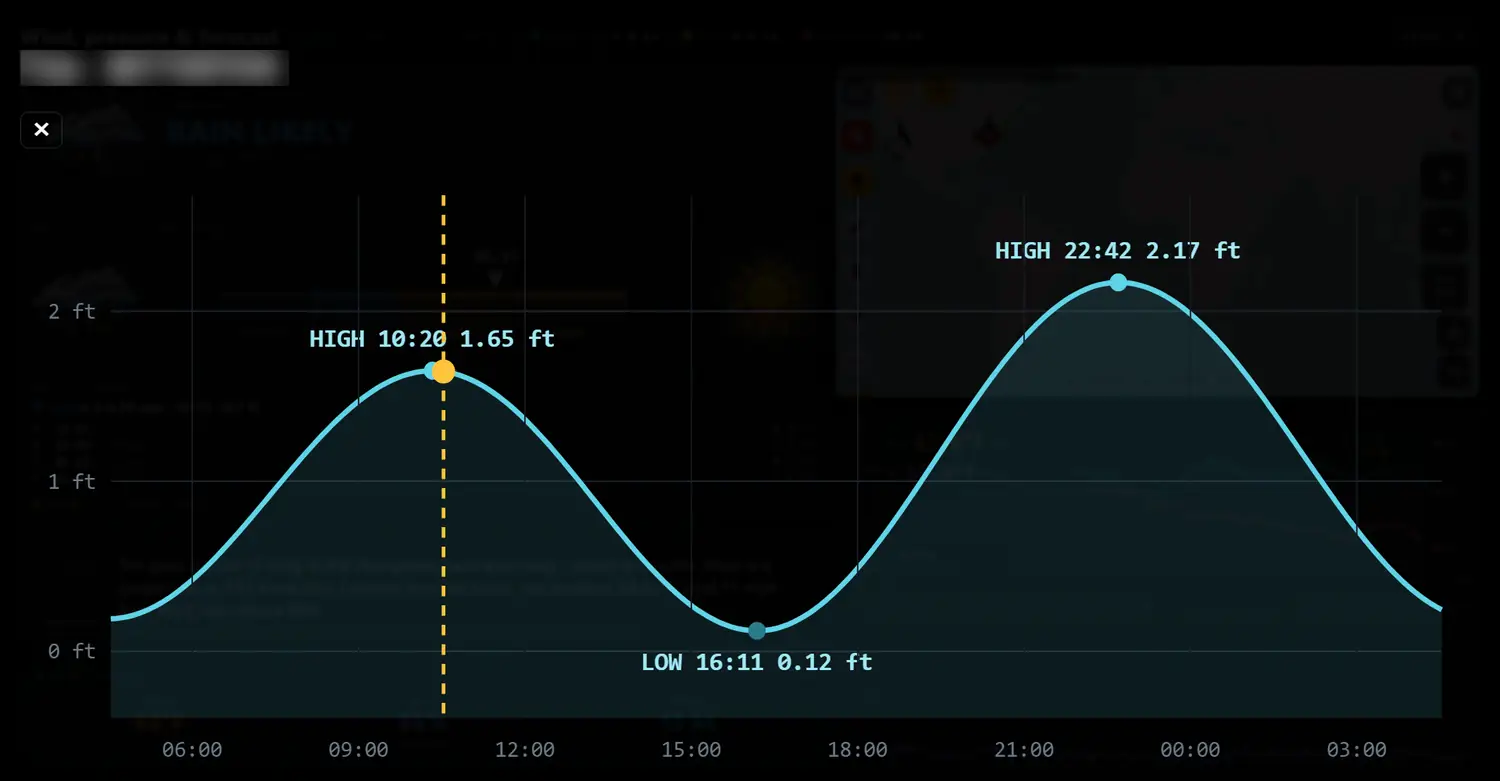
Tap the tide line in the bottom strip. The dashed line is now.
A smooth curve drawn through the official predicted highs and lows from the nearest tide station, with the next high and low marked and the height in feet. A glance tells you whether the water is rising or falling and how long until it turns.
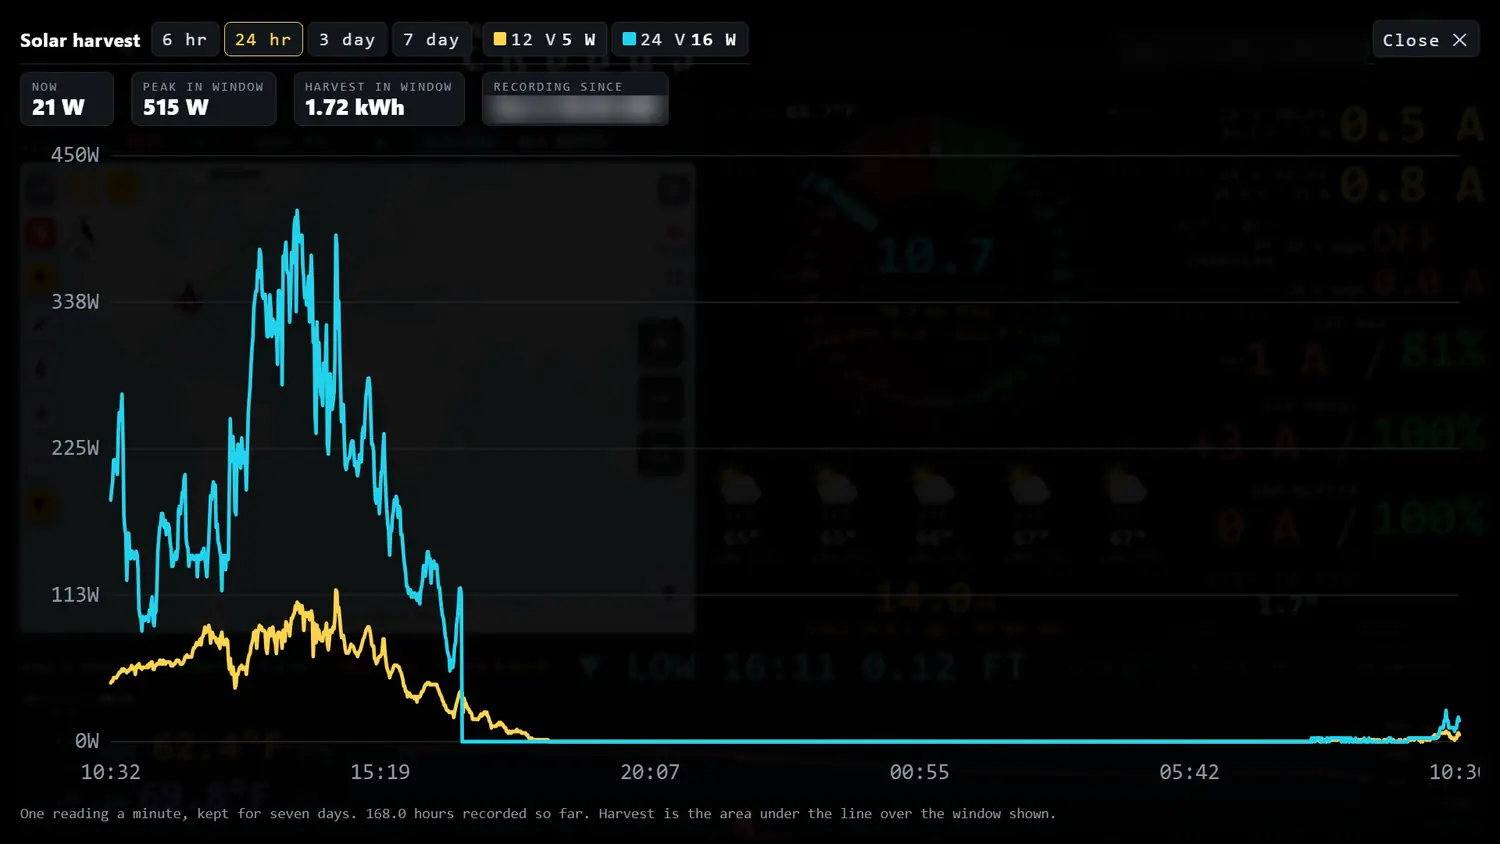
Tap either solar tile. The yellow line is the 12 volt array, the blue the 24 volt array.
How much power the panels have actually made, drawn as a line for the last six hours, a day, three days or a week. Along the top are the watts right now, the peak in the window and the energy harvested in kilowatt-hours, which is the area under the line. A shadow from a mast or a cloud is easy to spot as a notch.
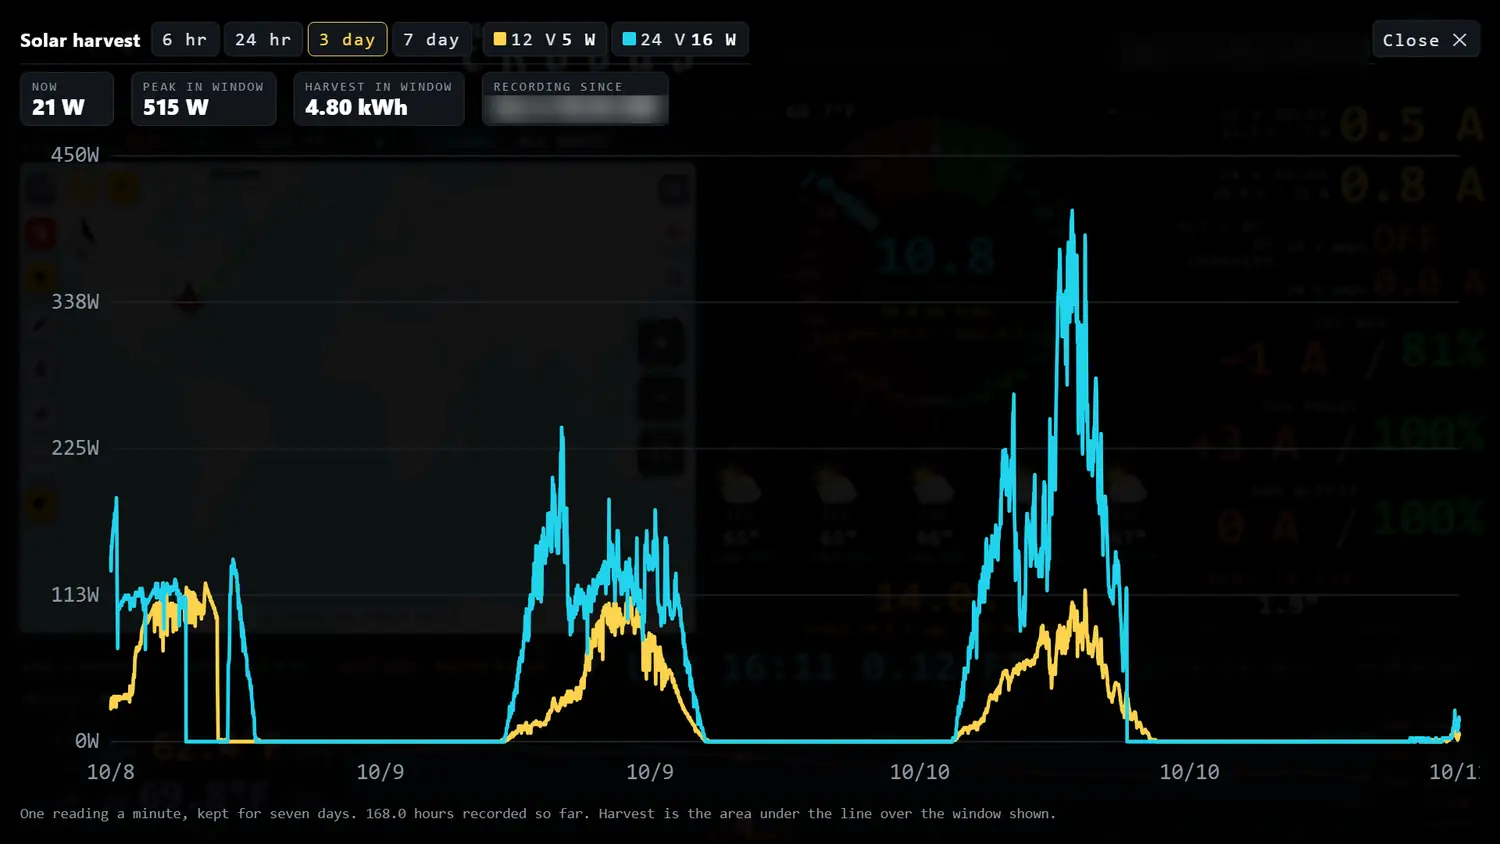
The three-day button. Three days side by side, with a very different day in the middle.
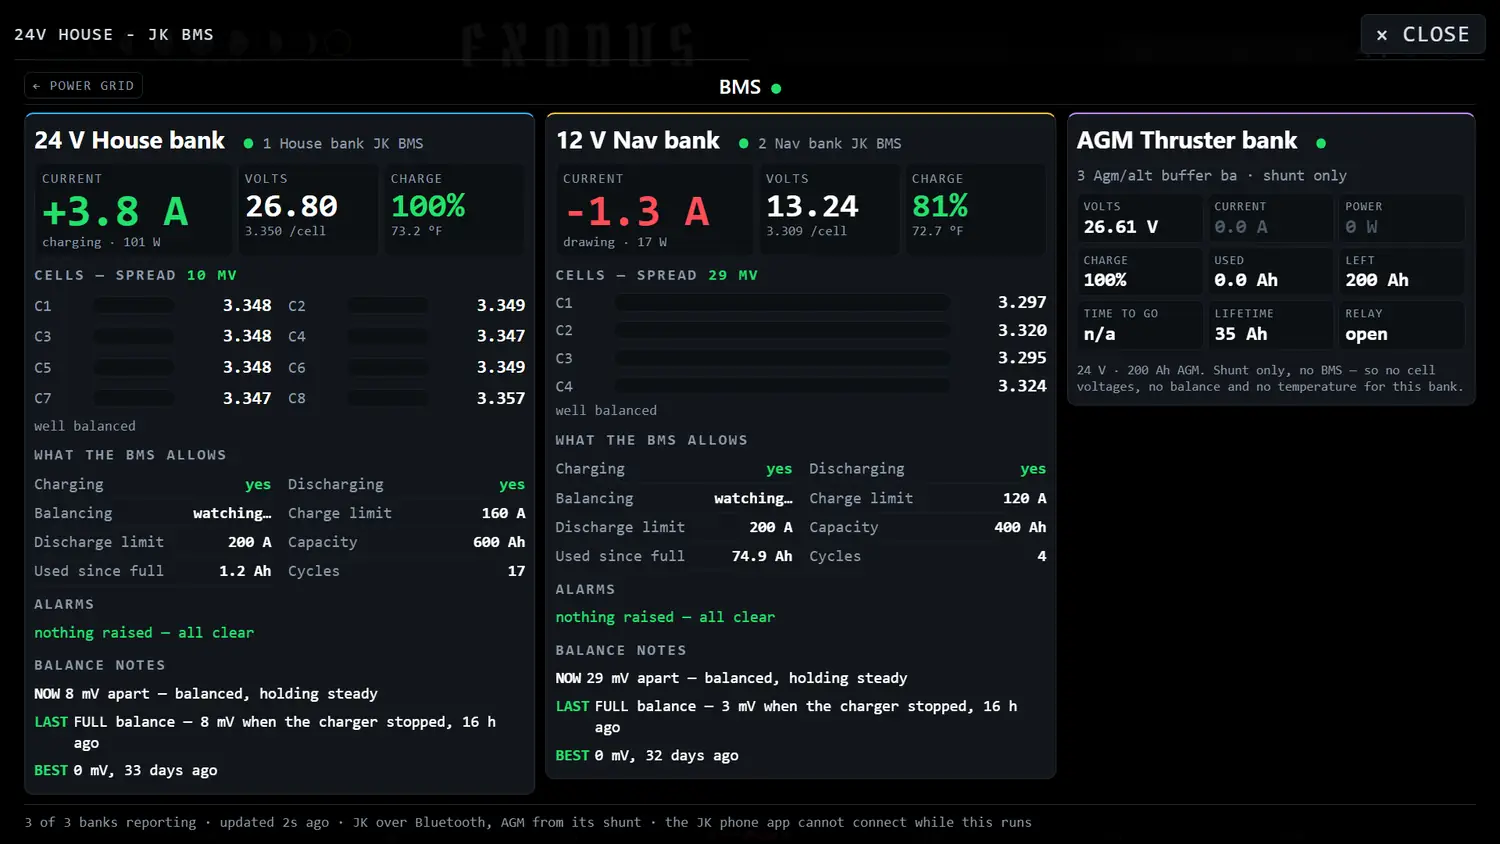
Tap the 12 volt nav, 24 volt house or AGM tile. The battery management page opens as a pop-up, titled with the bank you touched.
It's the same battery page described above, shown over the top without leaving the home screen. Close it and you're back.
The row of little weather icons for the next few hours opens a live Windy forecast map centred on the boat. It needs internet, so it only works when we have it, and it's left out of this page because it shows exactly where the boat is. The weather screen below is the full-page version.
The controls above the map tile set up a ring around the boat. AIS alarm switches it on or off. The minus and plus buttons make the ring smaller or bigger (it's set to 650 feet in the picture). The mode button picks whether it only warns about boats closing on us or about any boat inside the ring, and the last button decides whether to skip moored boats, so a harbour full of boats sitting on their moorings doesn't sound the alarm.
The Wi-Fi sign at the top right shows whether the boat has internet right now (a plain sign when it does, a sign with a red mark when it doesn't). The reload button next to it refreshes the screen. The moons along the top left are the phases for the coming days. The back button goes to the Power Grid.
The whole electrical system, drawn the way it's actually wired
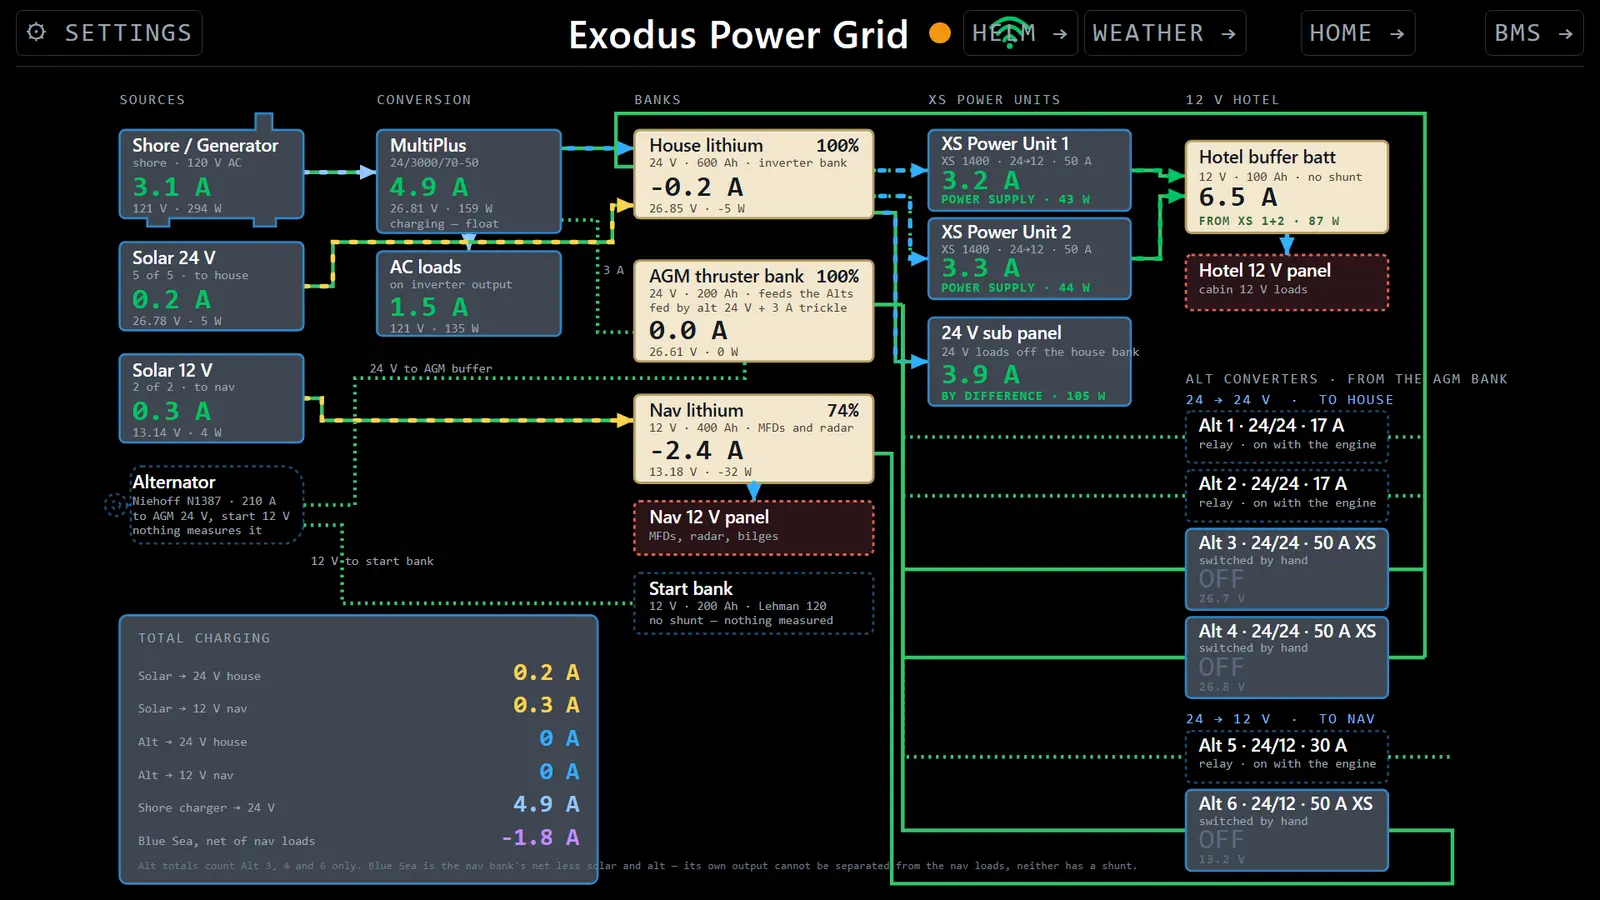
Sources on the left, banks in the middle, converters and loads on the right. Every box shows amps, volts and watts as measured.
Off-the-shelf battery screens show one bank, or one maker's gear. Ours has five banks, two voltages and a stack of DC-DC converters, and no shop sells a screen for that. So we drew the diagram an electrician would, and wrote the live numbers on it. The full story is here.
The buttons across the top
Across the top of the Power Grid are buttons to the other screens: Helm, Weather, Home, BMS and a Settings page. Each one is a full screen with a back button that brings you home, so the Power Grid works as the hub.
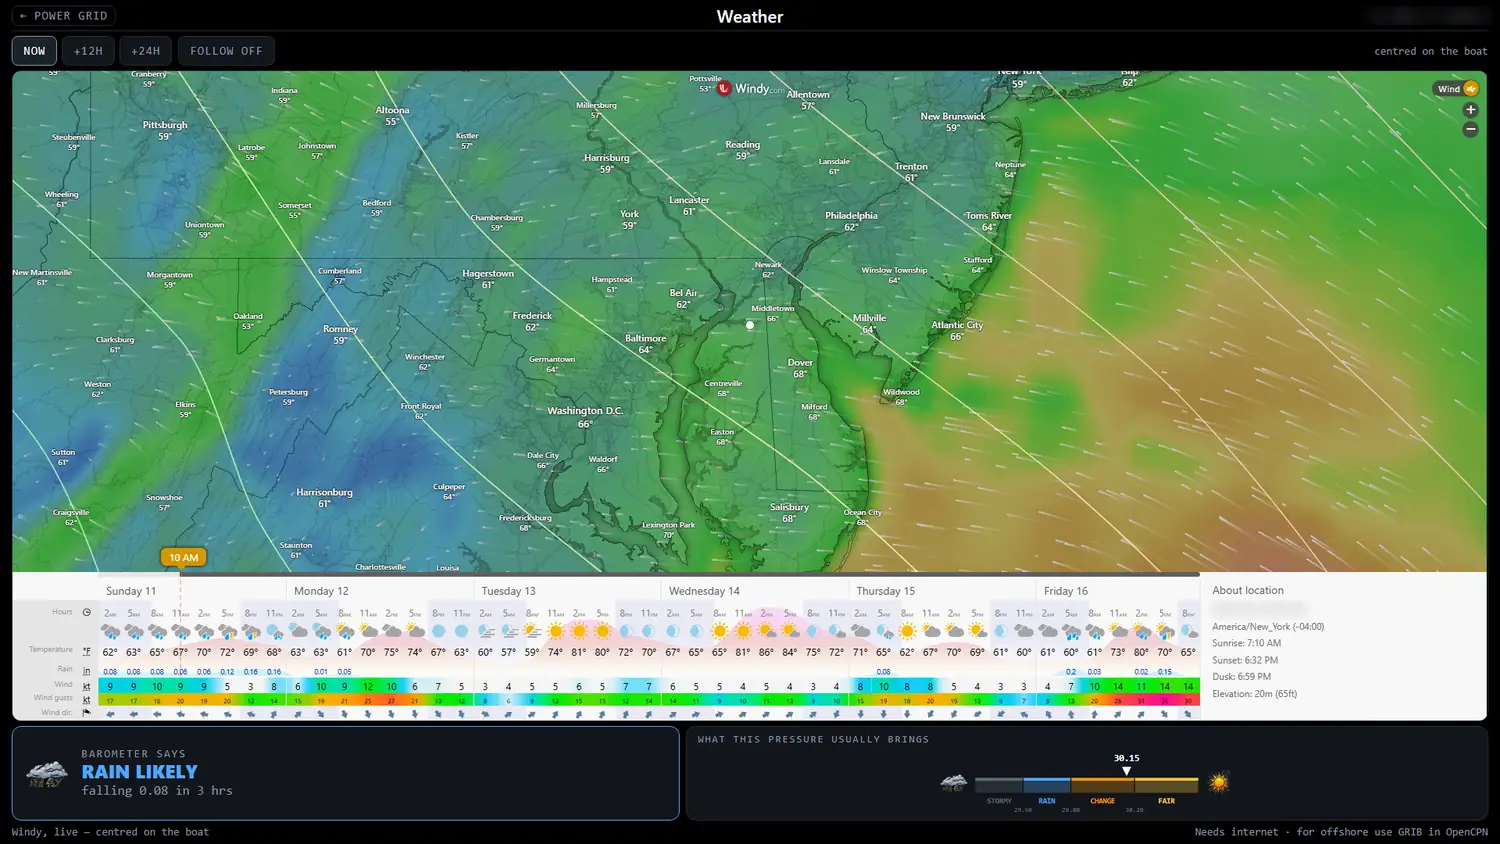
A live Windy map centred on the boat, a forecast table underneath, and the on-board barometer along the bottom. (Coordinates are blurred.)
The buttons at the top step the map from now to twelve hours and a day ahead, and one makes the map follow the boat. The two panels at the bottom come from the barometer, not the internet: what it says the weather will do, and a scale of what this pressure usually brings. The small print says the honest thing: the map needs internet, and for offshore passages the real tool is a GRIB file in OpenCPN.
A page for the boat's Wi-Fi: whether it's on a network or the cable, whether the boat's own hotspot is up, and a list of networks in range. It's not shown here because it lists the networks around the boat.
Every cell, every bank
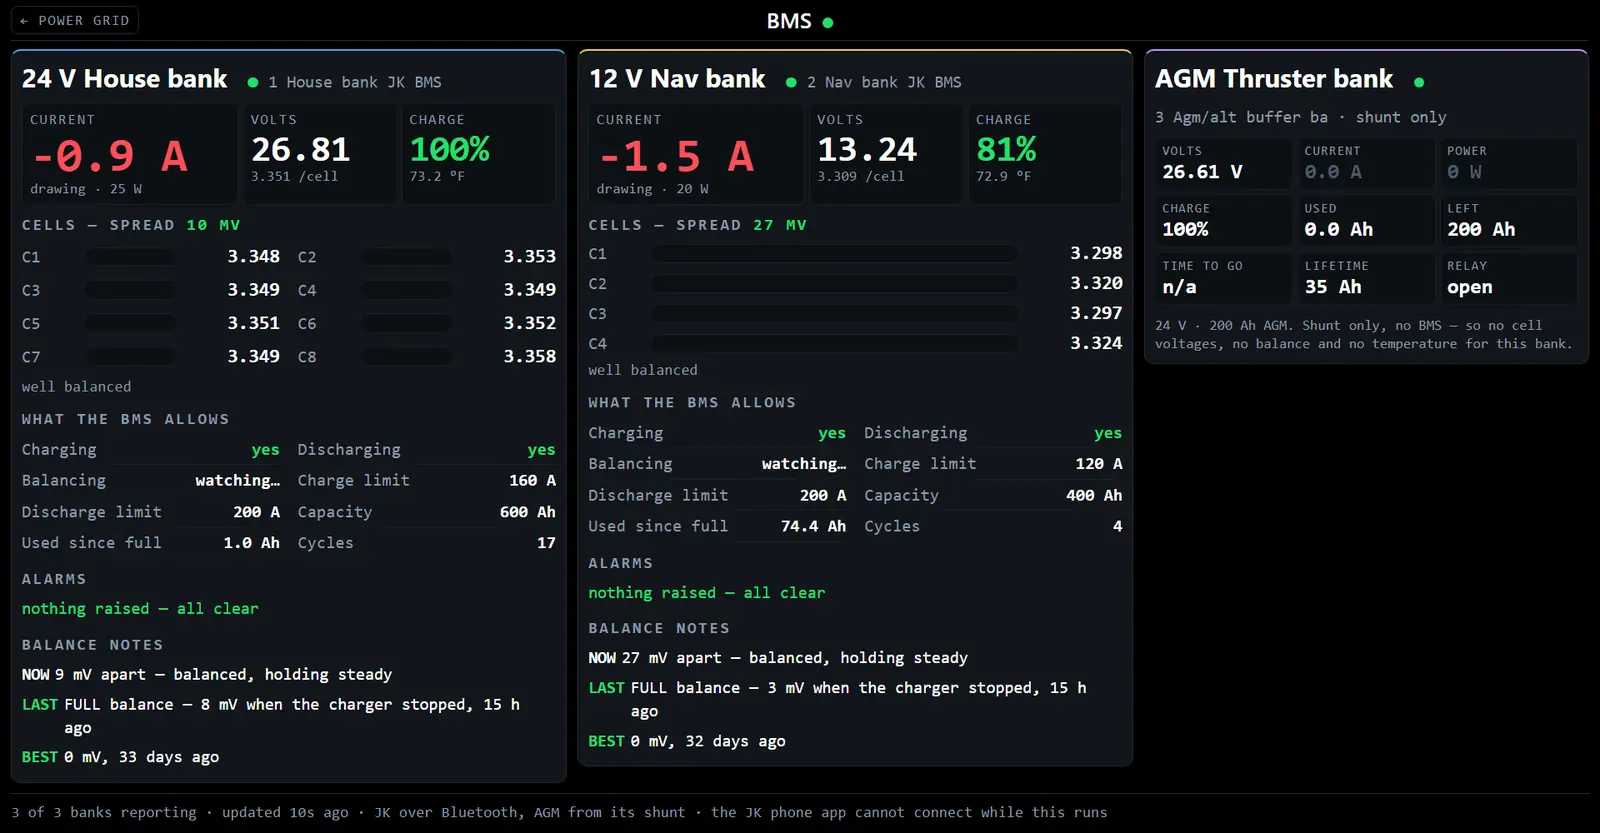
Cell by cell, with a plain-English line under each bank saying whether it's balanced.
The lithium banks each have their own battery management system. The phone app that comes with it can't run at the same time as ours, and it only ever shows one bank. This page shows them side by side, and here's how it's built.
Heel, pitch, heave, heading, rudder and speed
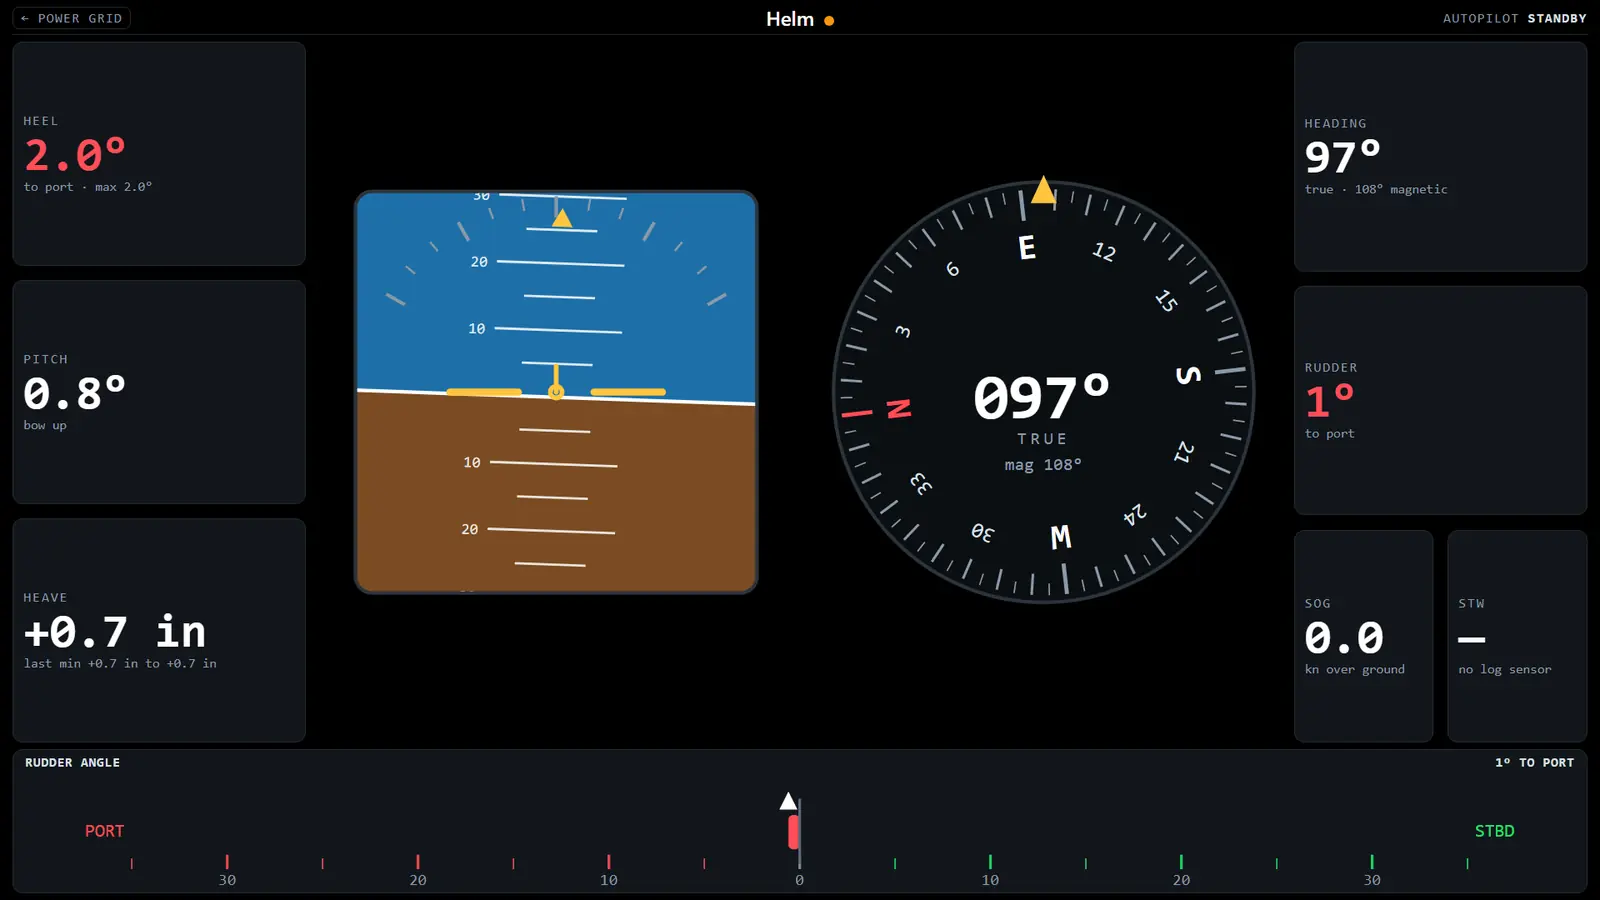
The artificial horizon, a compass, and a rudder bar across the bottom.
The horizon works like the one in an aircraft: the boat symbol stays put and the world tilts behind it, so how far we're heeled is something you read in a glance. Beside it is a compass that turns under a fixed pointer. Down the sides are heel, pitch and heave (the boat's up and down movement, in inches and feet), heading, rudder angle, speed over the ground and speed through the water. The rudder bar runs the full width of the bottom, red to port and green to starboard.
Speed through the water only shows a number when the boat's log sensor is reporting. Until then the tile says so rather than inventing one.
A big number for each probe, and a history behind it
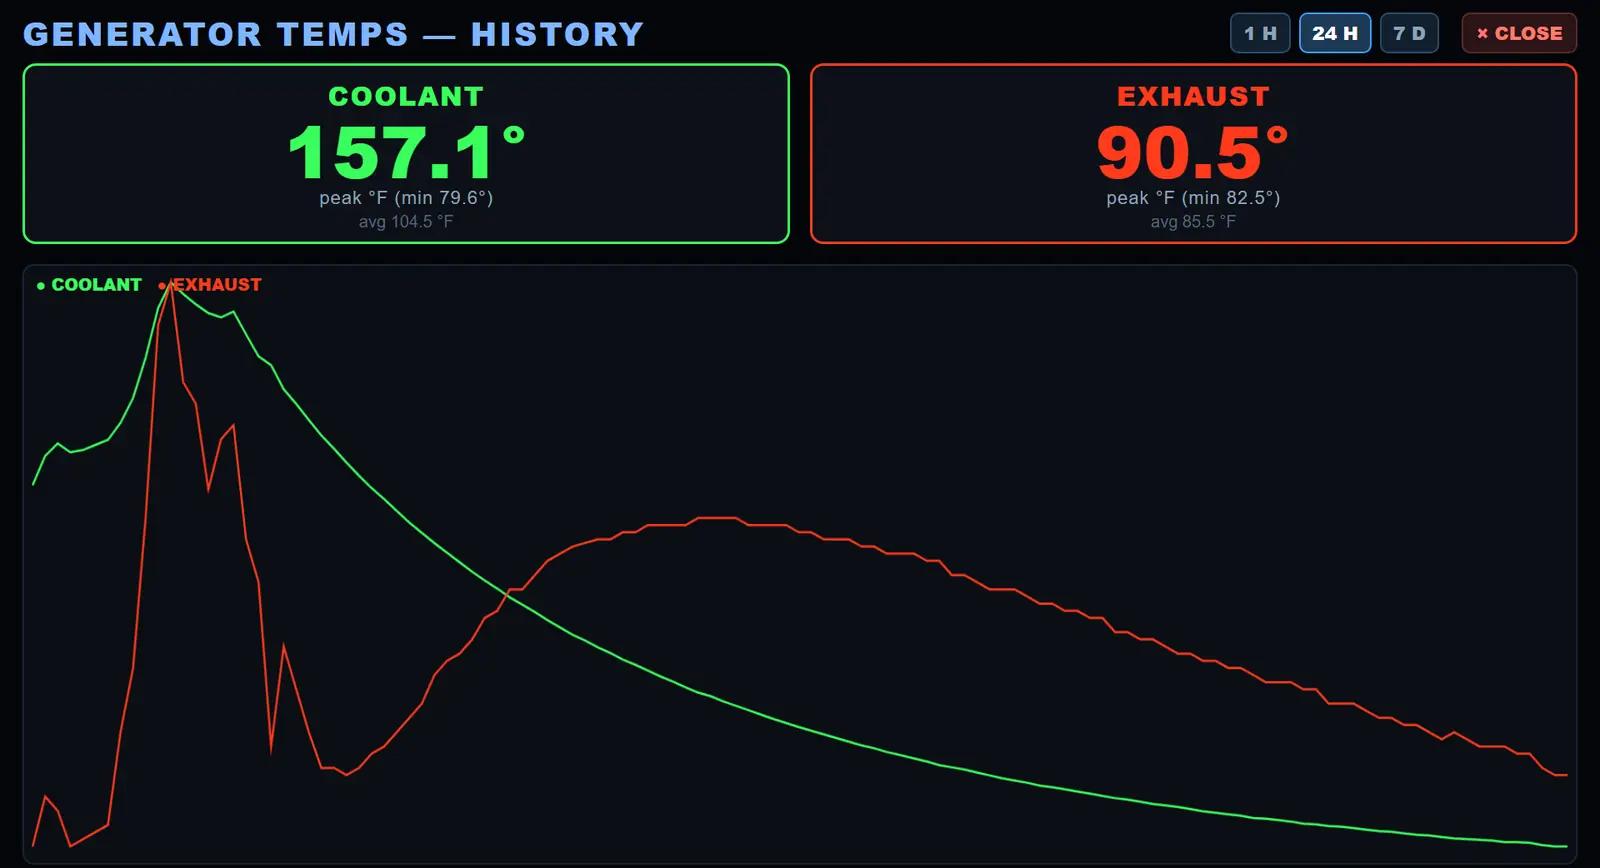
The history view: coolant (green) and exhaust (red), with the peak and the average for the window. This is real data from one of our earlier runs, a warm-up and then the long cool-down.
Two temperature probes watch the generator, and the screen shows each one large enough to read from the other side of the boat. The history button is the useful part. It draws the last hour, day or week with the peak and average, so we can tell whether the engine is running a little hotter than it used to, which is how a problem usually announces itself long before it's an emergency. The generator's AC voltage and current already appear on the Power Grid, in the shore and generator box. How the monitoring is built.
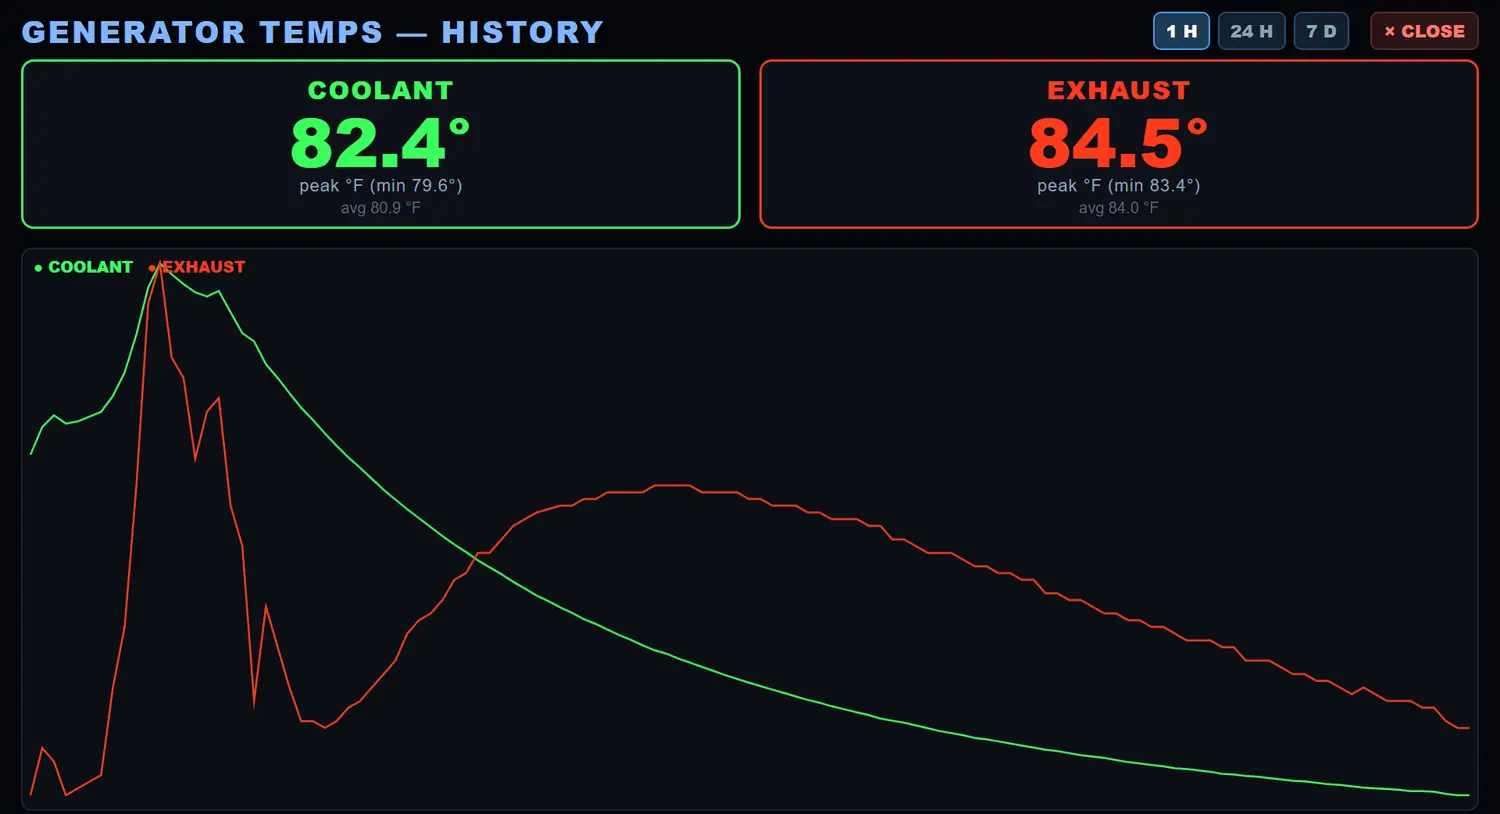
The 1 H button: the last hour on its own, with its own peak, low and average.
Three buttons across the top pick the window: one hour, twenty-four hours or seven days. Each redraws the lines and recalculates the numbers in the two boxes. The seven-day view is the one that shows a slow change, such as an engine that is creeping hotter from week to week, and it fills in as the Pi collects more. The close button returns to the two big temperatures.
We can't read its thermometer, so we listen for it instead
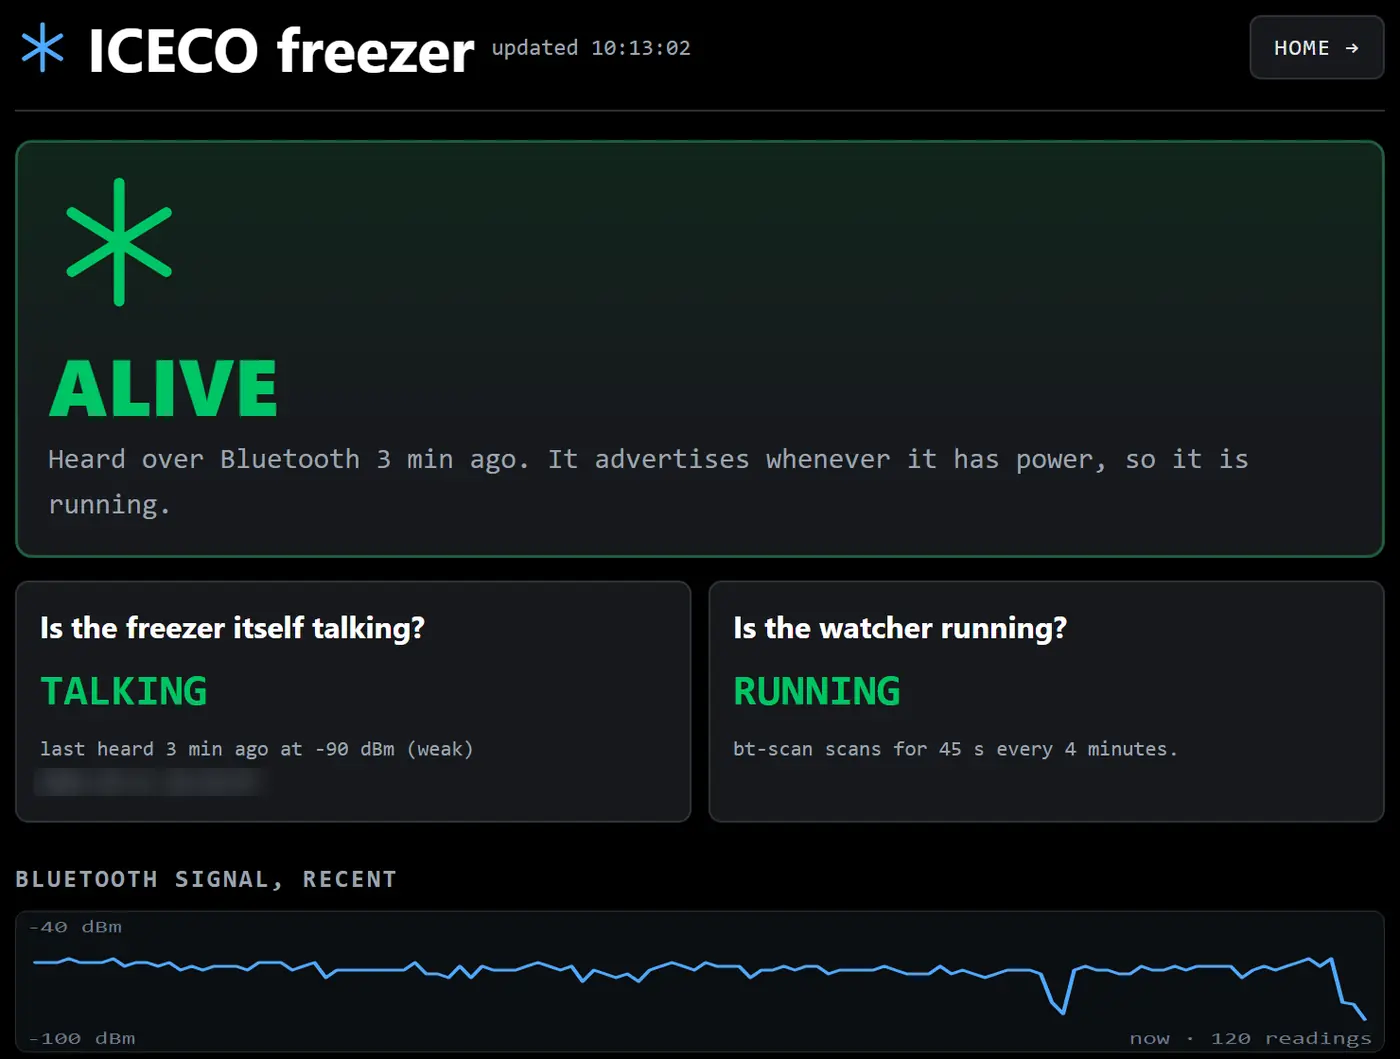
Alive, talking, and a graph of how loudly we can hear it.
Our freezer won't tell us its temperature. We tried; its Bluetooth broadcast simply doesn't carry one. But it does shout "I'm here" whenever it has power. So the Pi listens for it every few minutes. As long as we can hear it, it has power and it's running. If it goes quiet, something has cut its power: a tripped breaker, a switched-off panel, a bad connection. That's the failure that spoils a freezer of food without anybody noticing, and the Pi sends an alert when it happens.
Further down the same page there's a written section, "what the boat actually knows", that separates what we've measured from what we've only worked out. It's not shown here because it includes the freezer's Bluetooth address.
The honest limit: this tells us the freezer is on, not how cold it is. It's a cheap, reliable "is it still alive" check, and that's the one we care about.
A chat window for the whole boat, with no internet needed

A real question and a real answer, straight from the boat's live data.
Q is the boat's local AI. It's a chat window on a screen: you type or speak a question, it looks at the same live data the other screens use, and it answers in plain English. It runs aboard, so it works when the internet doesn't. More about Q and the voice side.
One page that opens everything
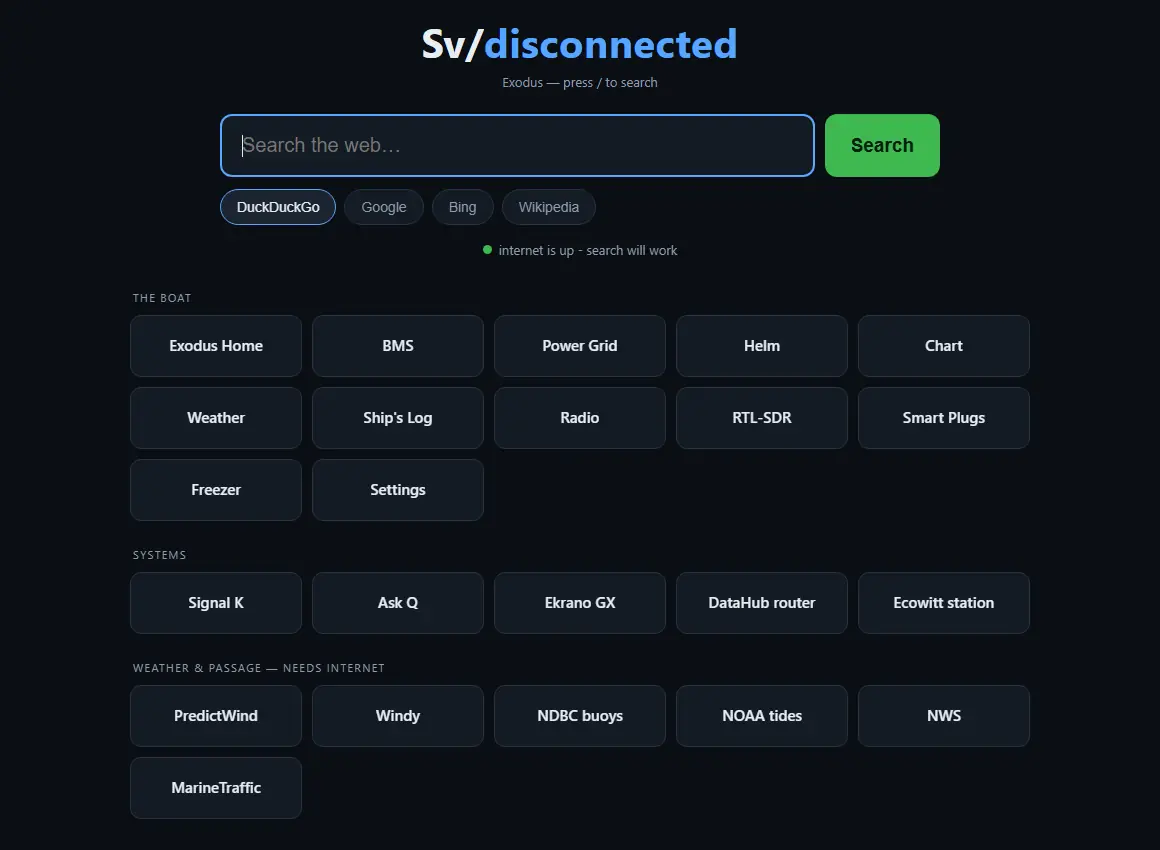
Big buttons for every screen, a few tools, and the weather sites for when there is internet.
Every screen above is one tap from here. The small print at the bottom is the most important line on it: local pages keep working with the internet down, and nobody should take a route or a course to steer from a search result.
The other half of this: cheap smart plugs, and a Pi that decides when they're on
Plenty of useful things aboard are dumb: a battery charger, a kettle, a heater. They have one job and no brain. A cheap smart plug and the Pi turn them into automatic devices that watch the battery before they draw power. Our chargers, block heater and kettle all work that way, and the whole write-up is its own page.
Some screens belong on the boat, not on a public website
There's a screen that lists every radio and Bluetooth device the Pi can hear, and a map of everything on the boat's network. They're genuinely useful at the boat, and exactly the kind of thing that shouldn't be published. The same goes for exact positions and device addresses: we blur them or leave the screen out. If you build your own, think about what's on your screens before you show anyone.